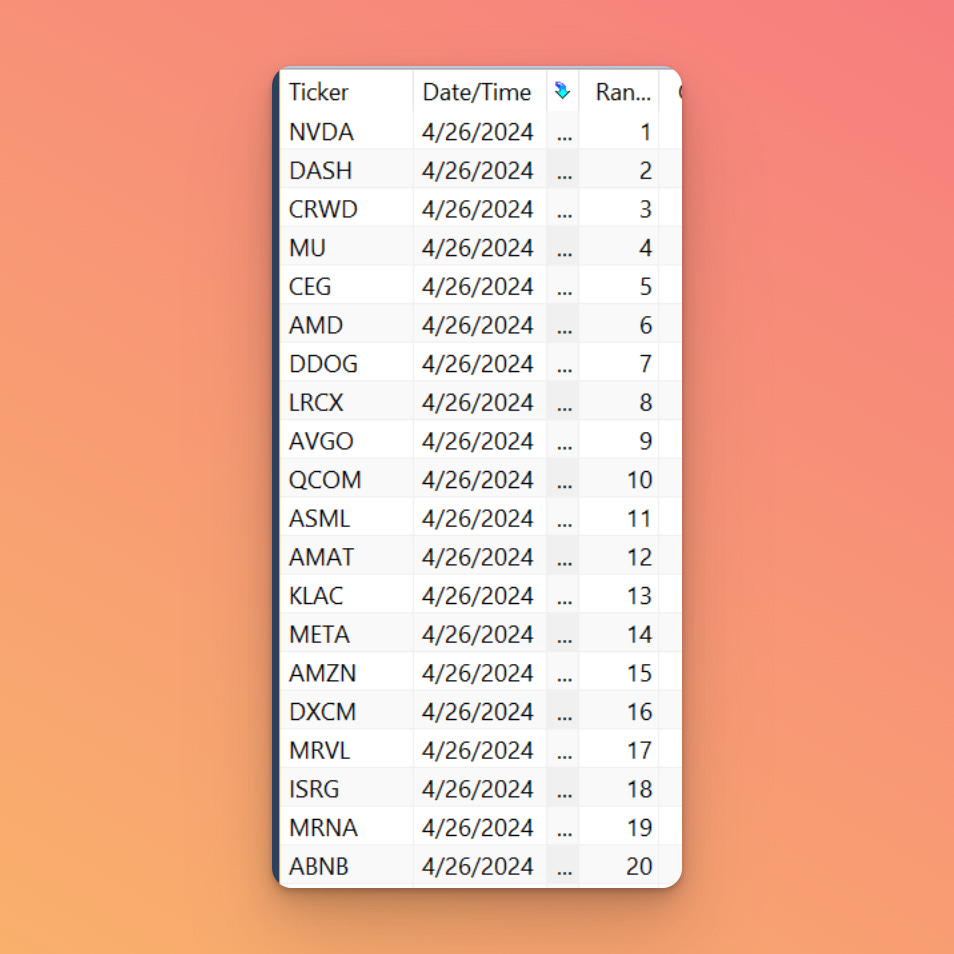
Key Points
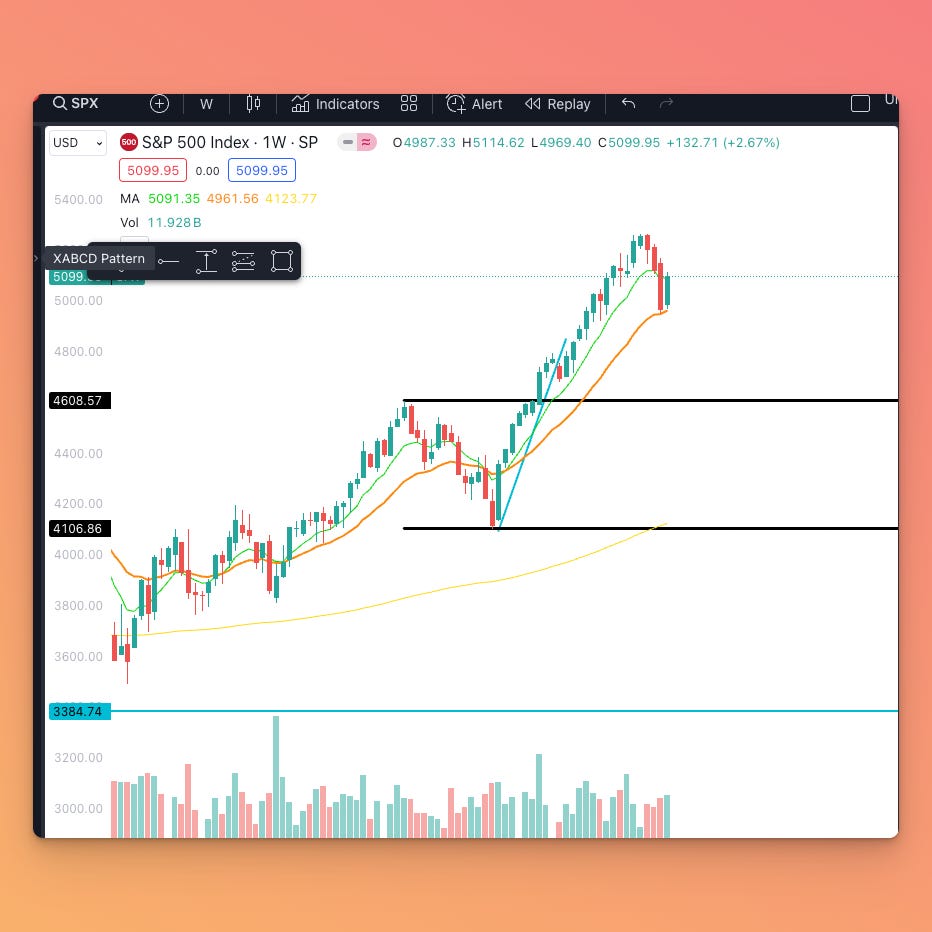
S&P500 index ended the 3 week losing streak, rising 2.7%.
Technology, consumer discretionary and communication services were the major contributors.
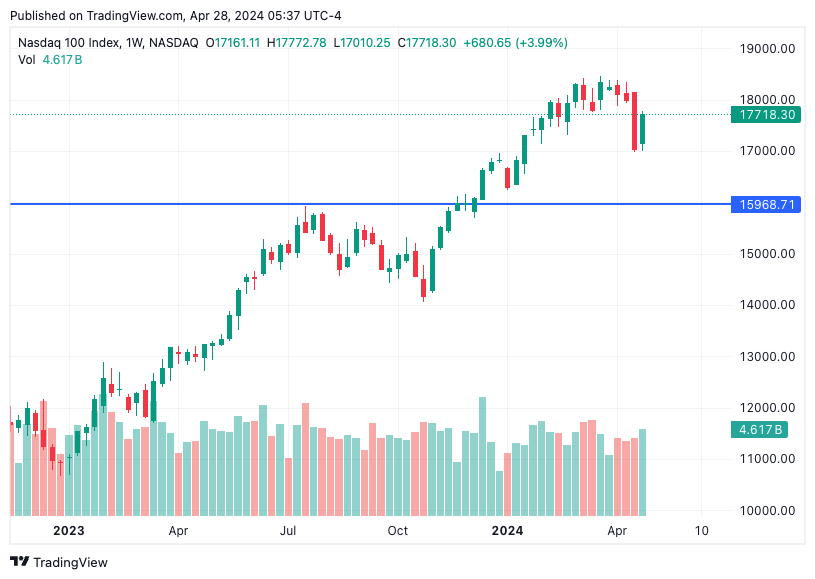
Same story in Nasdaq 100 - ended the 3 week losing streak rising 2.2%
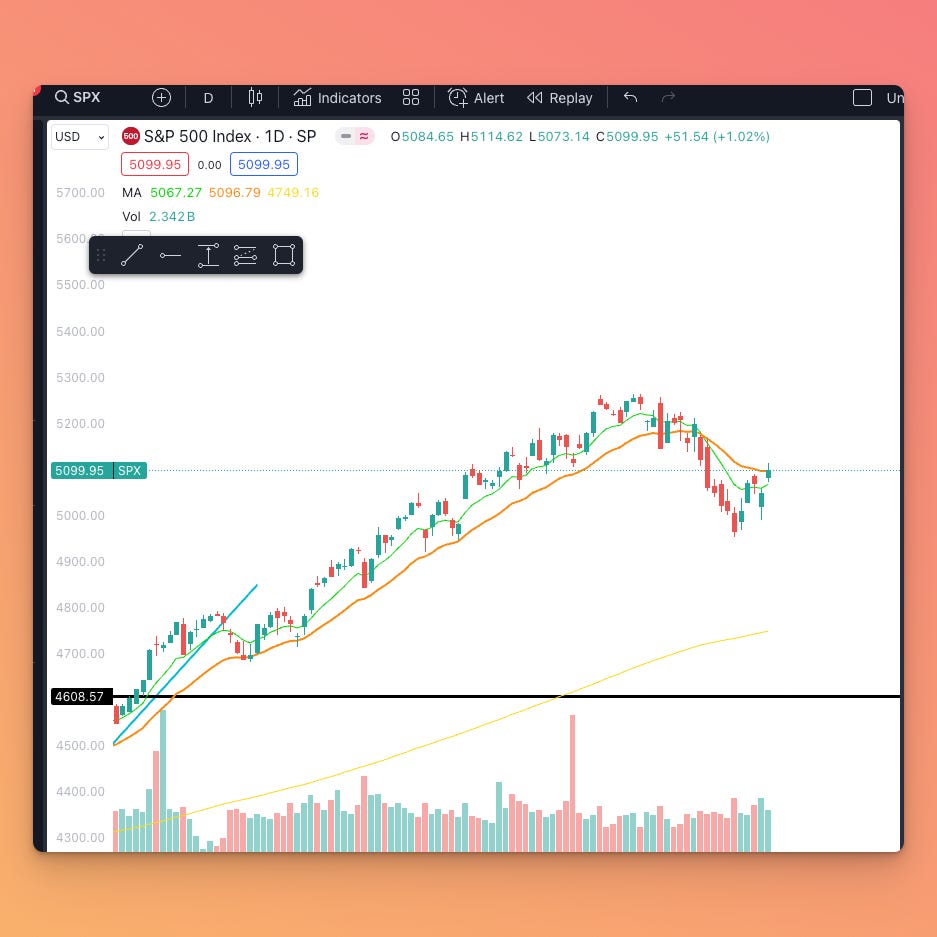
S&P500 index closed above 9 and 21 day Exponential Moving Average
Nasdaq 100 also closed above 9 and 21 day exponential moving average.
Chart Analysis
S&P 500 - Daily Timeframe
Price closed above the 9 and 21 day EMA.
S&P 500 - Weekly timeframe
In the weekly chart, the price is taking support near the 21 week EMA. It will be interesting to watch if this support level holds or if it gives way and price moves further down towards the previous breakout level near 4608.
NASDAQ 100 Daily
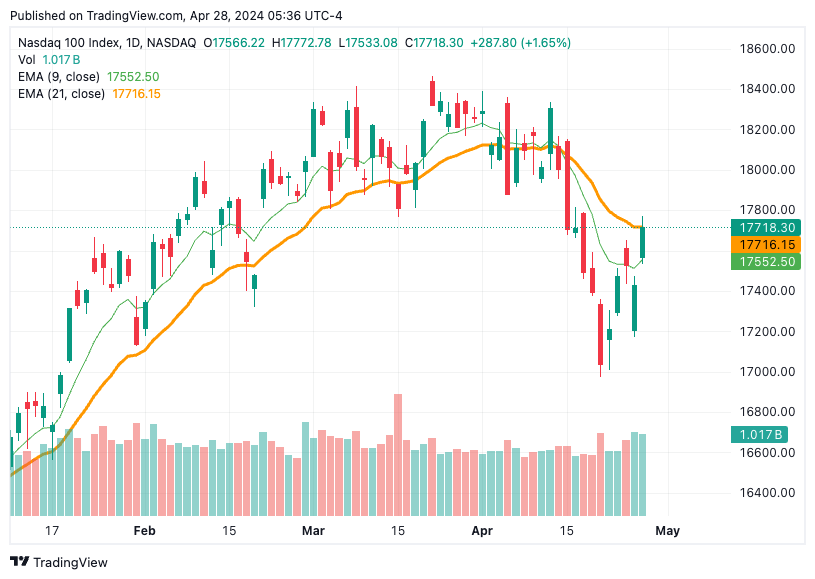
NASDAQ 100 - Weekly timeframe
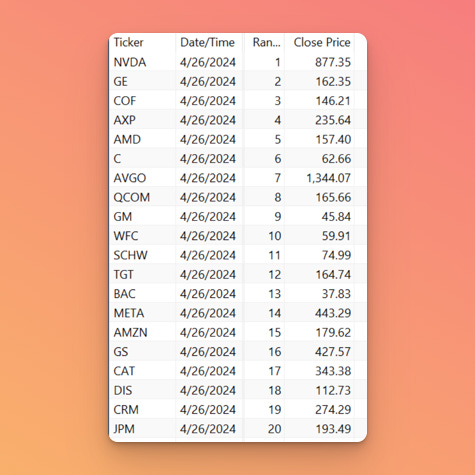
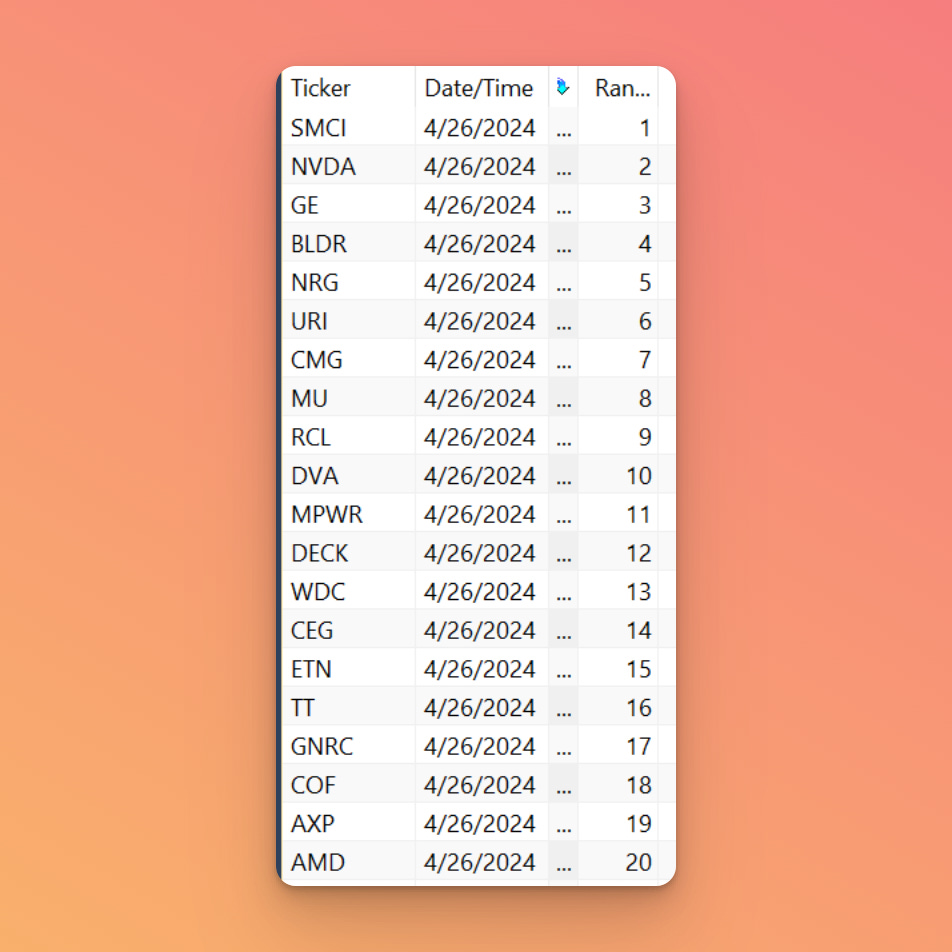
Top Momentum Stocks
S&P100
S&P500
Nasdaq 100
Changes: This week I’ve additionally included the daily and weekly charts of the indices. Please let me know if this is helpful by voting in the poll below.
If you want me to cover any other things in the weekly report, please let me know using the message option below or leave a comment.


